Instant Easy Access
PQWeb 4 Multi-Device Capability
- Desktop
- Laptop
- Tablet
- Mobile Device
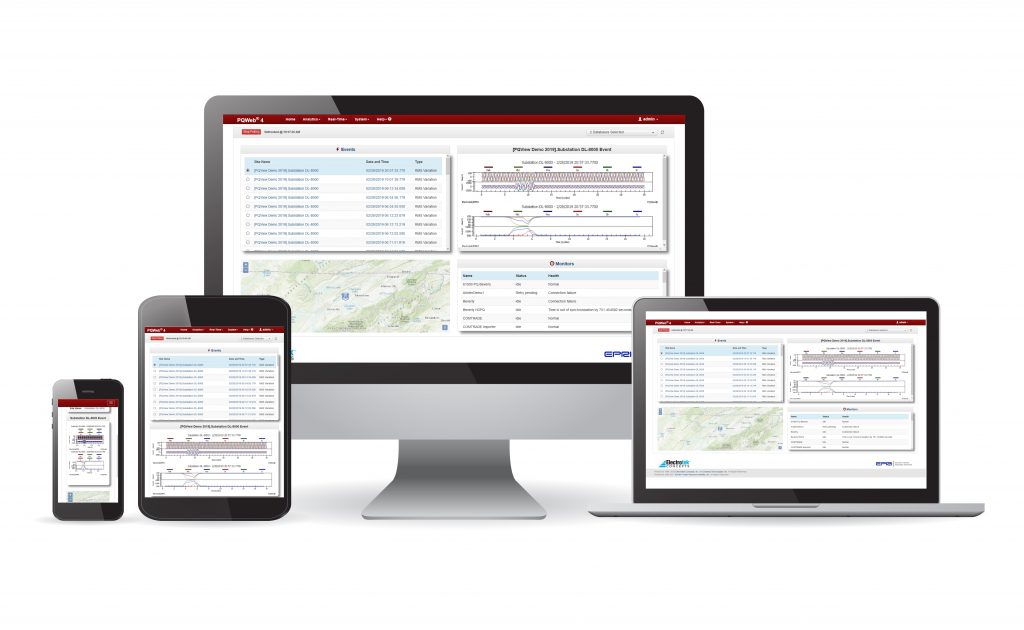
PQWeb 4 delivers the power of PQView in a web browser. Utilizing state-of-the-art web technology, PQWeb 4 provides the best user experience possible via a fully interactive website. The responsive design of PQWeb 4 looks great regardless of the device being used to view the content by automatically adjusting to the size of the screen. Interactivity is provided via HTML 5 and JavaScript which means PQWeb 4 works in any modern web browser.
Features
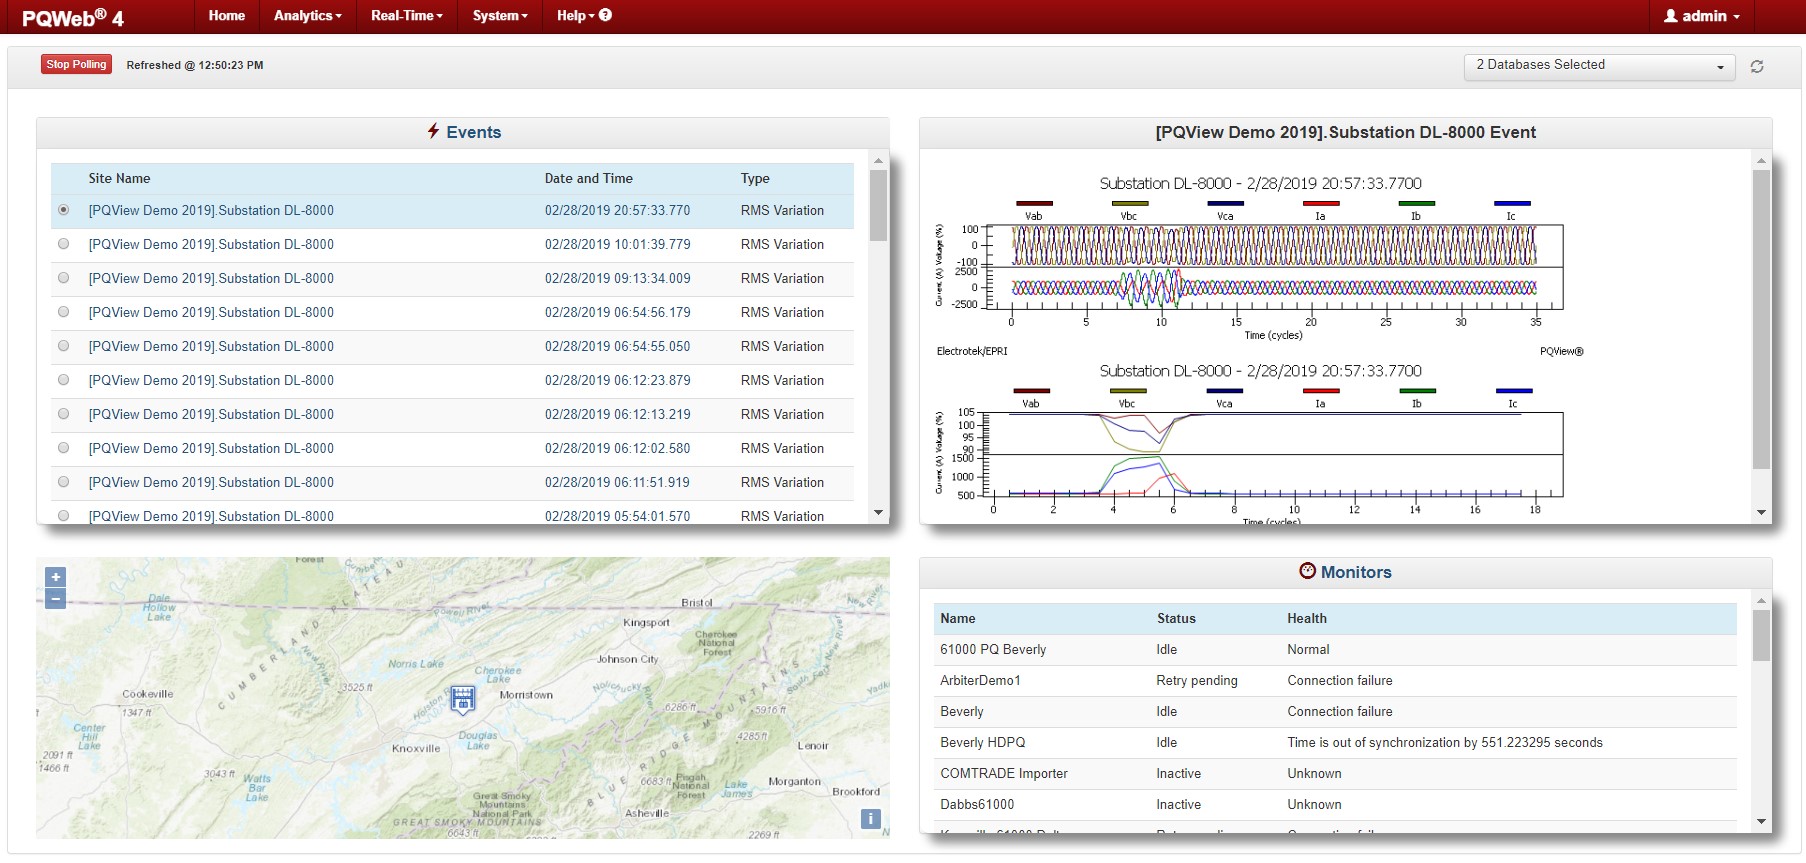
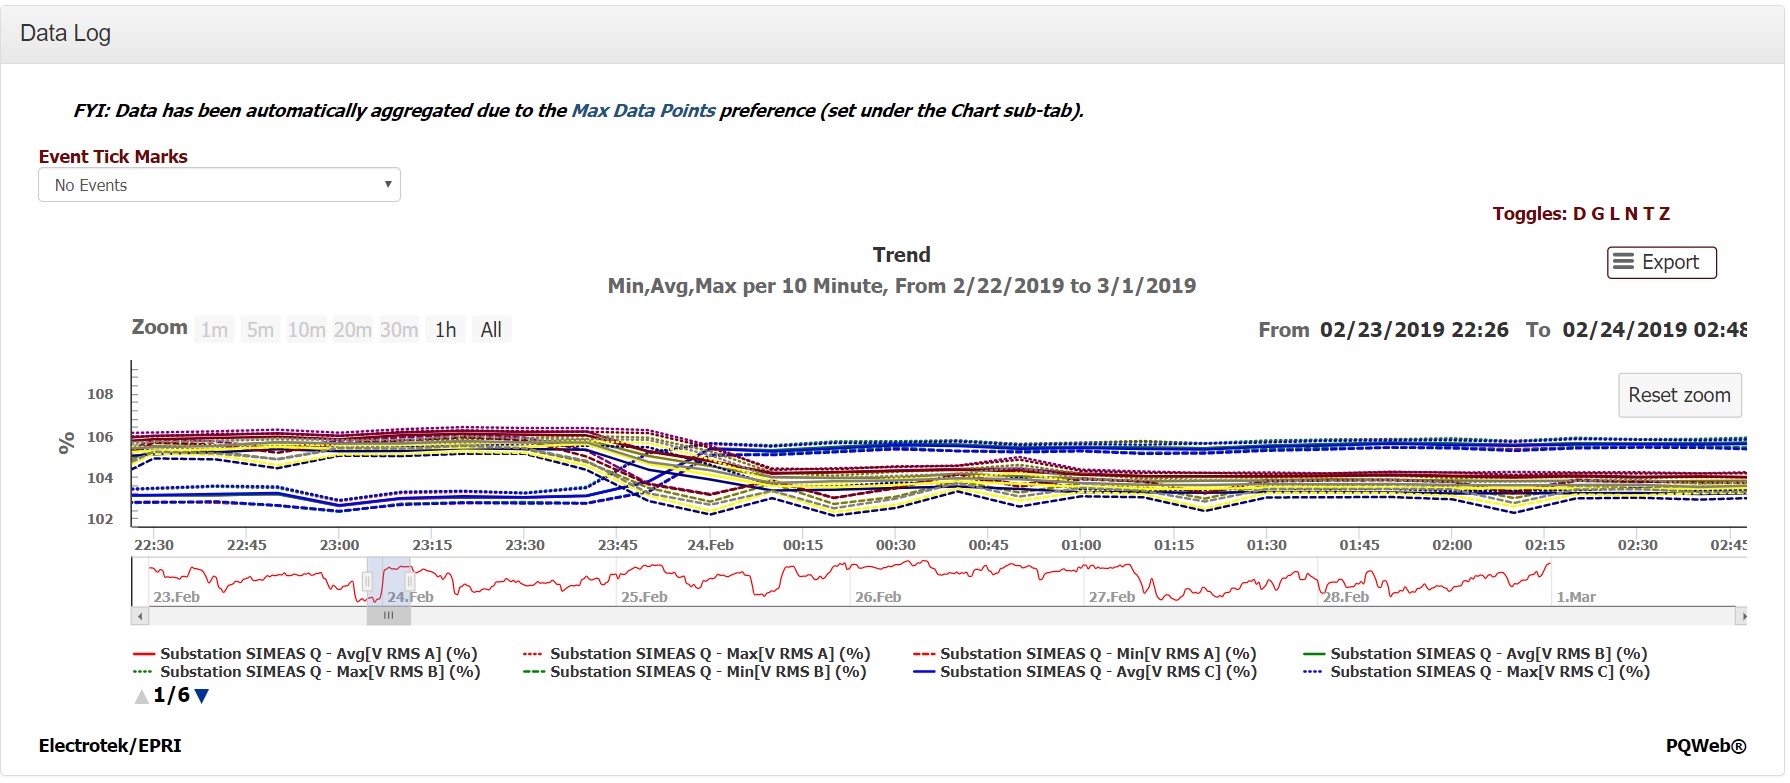
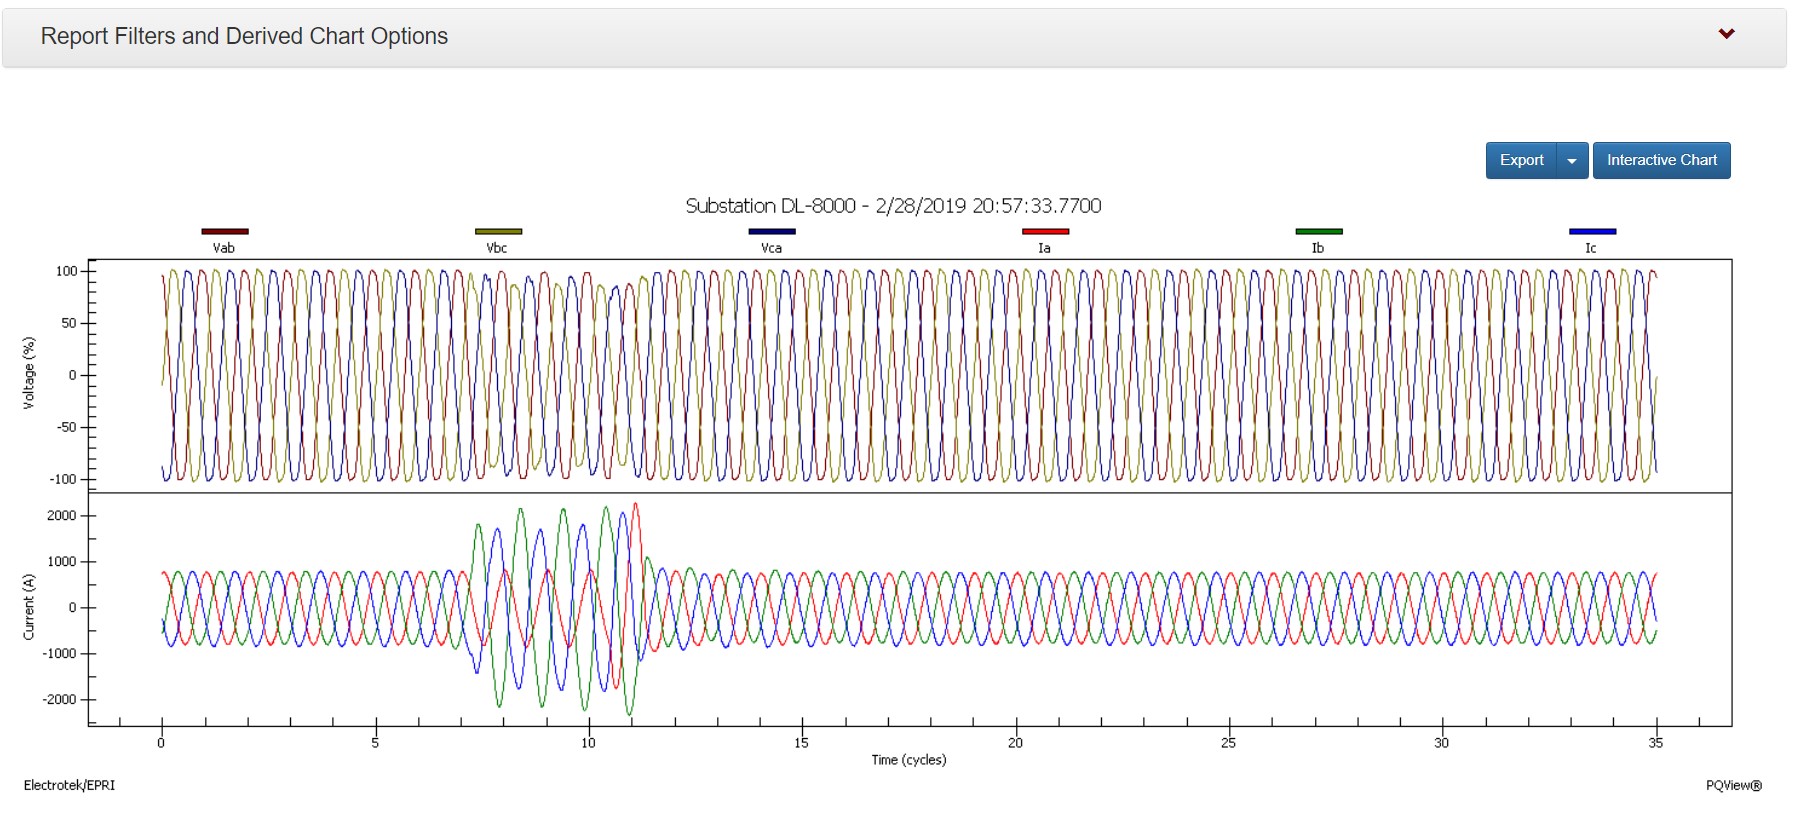
- View waveforms, data logs, and RMS variations
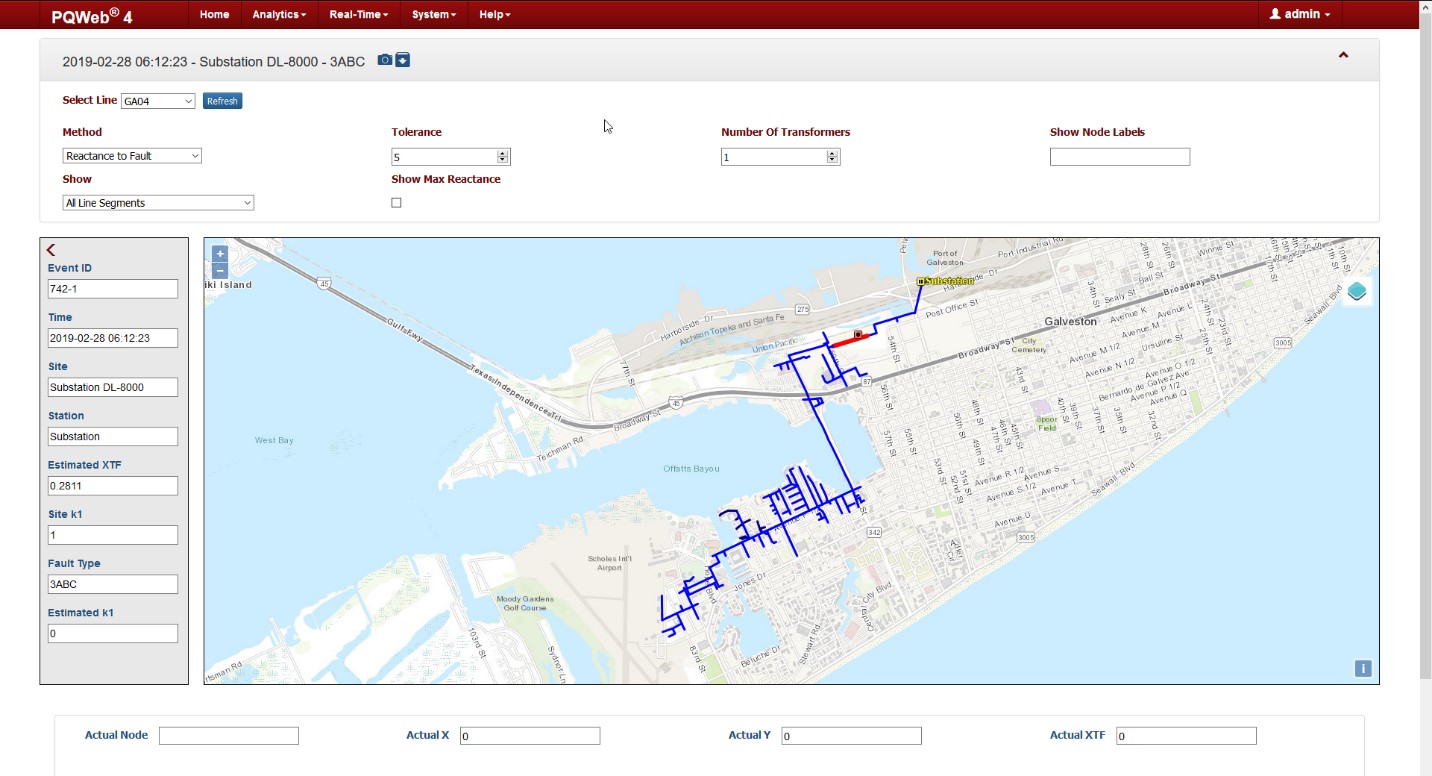
- Map events geographically
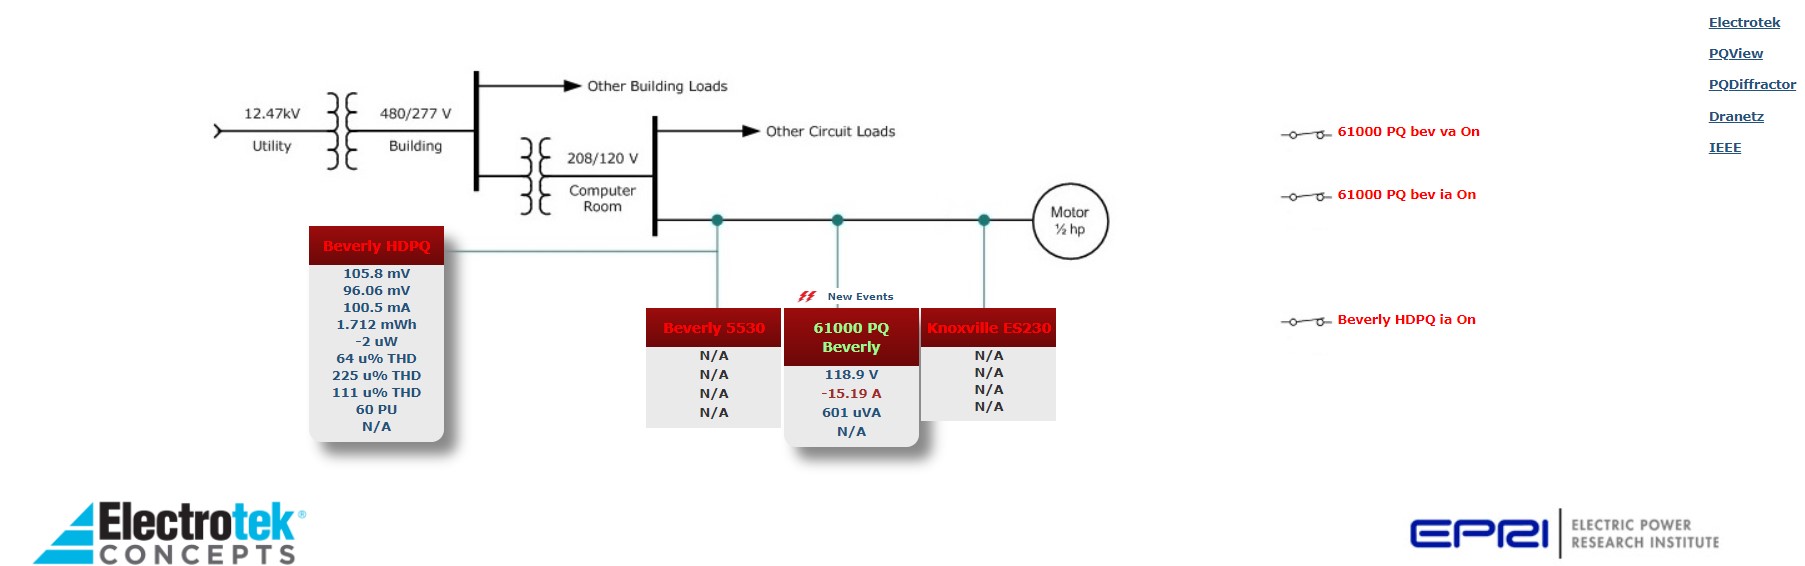
- View system at a glance via an interactive dashboard
- Advanced analysis provided via derived charts (first time ever in a web browser)
- View data from multiple devices for a single day or multiple years
- Responsive web design – looks great on your tablet, phone, PC, or Mac
- Interactivity provided via HTML 5 and JavaScript – works in any modern browser
- Distributed deployment allows for securing communication between user interface and backend services
- View Data from multiple systems at once – PQView 4 allows users to connect to multiple PQView Measurement Databases and multiple PQDMS instances in order to analyze data across multiple systems or manage communications with more than one monitoring system.